Data Table
The table below is showing us the data results of portable photosynthesis system. It includes various physiological data ( such as net photosynthesis, intercellular CO2 concentration, and transpiration rate) of the plant sample that is tested by the portable photosynthesis system. The sampling unit used in my project is individual plant. The physiological data was collected from one mature leaf of every collected plant sample. And I collected six samples from each tree species in each treatment group.
Photo: net photosynthesis; Cond: stomatal conductance to H2O; Ci: intercellular CO2 concentration; Trmmol: transpiration rate; Fv'/Fm': fluorescence
Photo: net photosynthesis; Cond: stomatal conductance to H2O; Ci: intercellular CO2 concentration; Trmmol: transpiration rate; Fv'/Fm': fluorescence
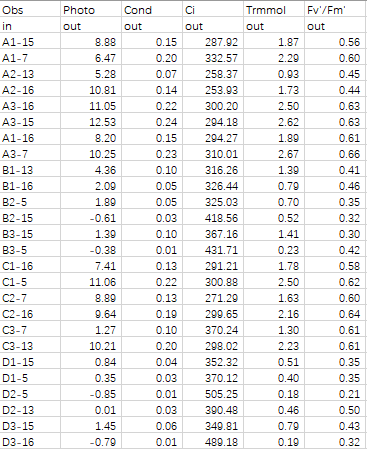
Table 1. Physiological data from LI-6400 XT portable photosynthesis system, including net photosynthesis, stomatal conductance to H2O, intercellular CO2 concentration, transpiration rate, and fluorescence.
Exploratory Graphics
|
A. Aerated control: 50% Hoagland solution
B. Aerated tailing water treatment: 50% Hoagland solution : tailing water (1:1, v/v) C. Hypoxic control: 50% Hoagland solution D. Hypoxic tailing water treatment: 50% Hoagland solution : tailing water (1:1, v/v) |
A_photo: net photosynthesis in A treatment groups
B_photo: net photosynthesis in B treatment groups C_photo: net photosynthesis in C treatment groups D_photo: net photosynthesis in D treatment groups |
Mean net photosynthesis boxplot
Net photosynthesis is the increase (or decrease) of the dry matter of plants that results from the difference between gross photosynthesis and losses due to the respiration and the death of the plant part. This physiological parameter can intuitively show the growth condition of plants and help us compare the effects of different treatment groups.
From the boxplots of net photosynthesis of four tree species in four treatments, we can observe that the oil sands tailings water and hypoxia indeed affect the growth of plants. In Trembling aspen (Fig 6), since the net photosynthesis in the B treatment group and D treatment group are similar, the effects of oil sands tailings water (B_photo and D_photo) on the plant growth is significantly higher than hypoxia (C_photo). For Paper birch (Fig 7), the effects of tailings water alone and hypoxia alone are similar (B_photo and C_photo), while the superposition of the effects of tailings water and hypoxia will further inhibit the photosynthesis process (D_photo). Besides, the net photosynthesis in the D treatment group of Paper birch also has the lowest spread. When it comes to Black spruce (Fig 8), its net photosynthesis has opposite trends to Trembling aspen. It is obvious that the effects of hypoxia on plant growth are stronger than tailings water in Black spruce. Moreover, the hypoxia does not aggravate the negative effects of tailings water (D_photo). For Jack pine (Fig 9), the effects of hypoxia and tailings water slightly inhibit the photosynthesis process in group C and group D. The B group, which is treated with tailings water, has the lowest spread and higher net photosynthesis than the control group (A treatment group).
From the boxplots of net photosynthesis of four tree species in four treatments, we can observe that the oil sands tailings water and hypoxia indeed affect the growth of plants. In Trembling aspen (Fig 6), since the net photosynthesis in the B treatment group and D treatment group are similar, the effects of oil sands tailings water (B_photo and D_photo) on the plant growth is significantly higher than hypoxia (C_photo). For Paper birch (Fig 7), the effects of tailings water alone and hypoxia alone are similar (B_photo and C_photo), while the superposition of the effects of tailings water and hypoxia will further inhibit the photosynthesis process (D_photo). Besides, the net photosynthesis in the D treatment group of Paper birch also has the lowest spread. When it comes to Black spruce (Fig 8), its net photosynthesis has opposite trends to Trembling aspen. It is obvious that the effects of hypoxia on plant growth are stronger than tailings water in Black spruce. Moreover, the hypoxia does not aggravate the negative effects of tailings water (D_photo). For Jack pine (Fig 9), the effects of hypoxia and tailings water slightly inhibit the photosynthesis process in group C and group D. The B group, which is treated with tailings water, has the lowest spread and higher net photosynthesis than the control group (A treatment group).

|

|
|
Fig 6. Trembling aspen net photosynthesis boxplot of four treatment groups.
|
Fig 7. Paper Birch net photosynthesis boxplot of four treatment groups
|

Fig 8. Jack Pine net photosynthesis boxplot of four treatment groups
|

Fig 9. Black Spruce net photosynthesis boxplot of four treatment groups
|
Residual plot
Fig 10 is showing us the residual plot of original net photosynthesis data of four tree species in four treatments. From this residual plot, we can see that the assumption of normality and homogeneity of data are acceptable. But there are also outliers in this residual plot

Fig 10. Residual plot of the original net photosynthesis data of four tree species from four treatments
Interaction plot
Fig 11 demonstrates the change of average net photosynthesis of four tree species between four treatments. Four lines represent four species, the x-axis represents four treatments, and the y-axis represents the mean of net photosynthesis. From this interaction plot, we can see that the aerated tailing water treatment significantly inhibits the photosynthesis of tree species apart from jack pine. Besides, the hypoxic treatment also inhibits the photosynthesis of tree species compared to the control. However, trembling aspen and paper birch in hypoxic treatment have better performance than aerated tailing water treatment. At last, the hypoxic tailing water treatment further inhibits photosynthesis based on aerated tailing water treatment. At the same time, it is worth noting that jack pine and black spruce have slightly better performance than the hypoxic treatment.

Fig 11. Interaction line plot of the net photosynthesis mean of four tree species in four treatments
